"Punchcard" graphs for Bazaar
GitHub has a nice feature called "Punchcard". It's a graph that represents numbers of commits by day and hour (example). You can easily see wherether a project was hacked over weekends or nights, if it's done by full-time employees, etc. There are two problems though:
- It ignores timezones. All timestamps are treated as if they were somewhere in the US. For projects where committers live across the world (most open source projects) it's therefore almost useless.
- It only works for GitHub projects, obviously.
I've put together a little Bazaar plugin that can generate similar graphs for Bazaar branches. You can get the plugin here. It requires PyQt for image drawing, but many Bazaar users should already have PyQt installed. Once you install the plugin, you can generate a "Punchcard" by running a command like this in a branch directory:
bzr punchcard project-punchcard.png
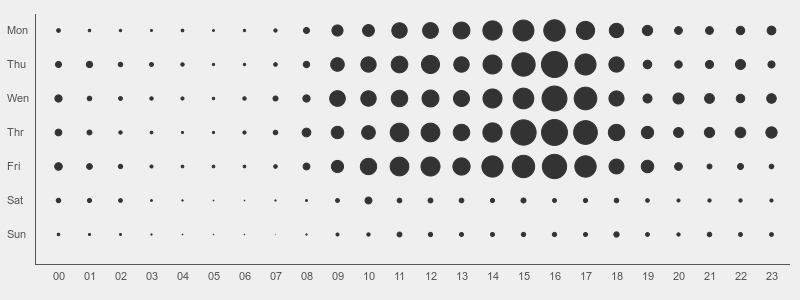
For example, for QBzr you will get this graph:
You can see that the project is done by people who obviously have too much free time. There is activity pretty much any time. I guess only on weekend nights, people are tired and enjoy some sleep. :)
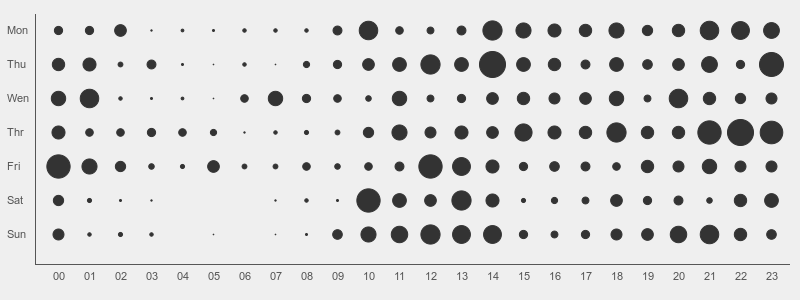
On the other hand, Picard was hacked by people with good sleep patterns over evenings and weekends:
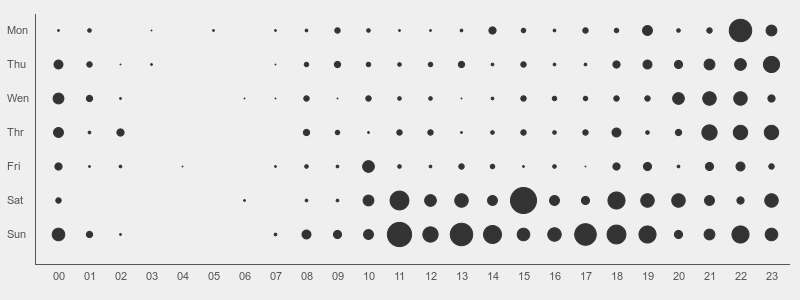
MusicBrainz Server is in a similar situation, minus the good sleep patterns:
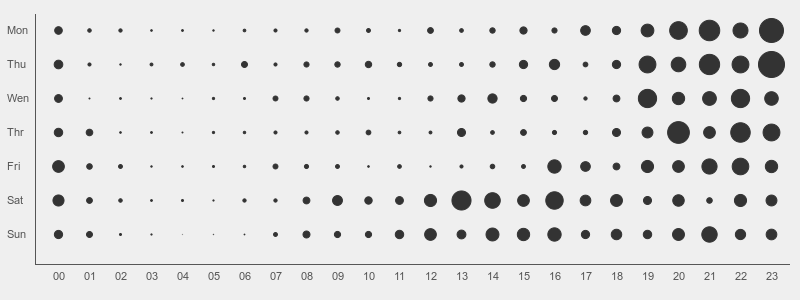
The last example is Bazaar. It's mostly written by full-time employees and it shows: