How does Chromaprint work?
I've been meaning to write this post for a long time, but never really finished it. I hope it will help people understand how does the Chromaprint algorithm work, where do the individual ideas come from and what do the fingerprints really represent. It's not meant to be a detailed description, just the basics to get the general idea.
Being primarily based on the Computer Vision for Music Identification paper, images play an important role in the algorithm. When people "see" audio, they usually see it as waveforms:
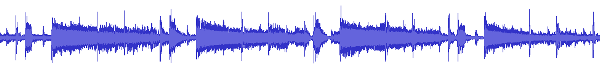
This is what most applications display, but it's not really useful for analysis. A more useful representation is the spectrogram, which shows how does the intensity on specific frequencies changes over time:
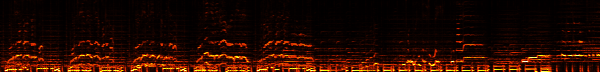
You can get this kind of image by splitting the original audio into many overlapping frames and applying the Fourier transform on them ("Short-time Fourier transform"). In the case of Chromaprint, the input audio is converted to the sampling rate 11025 Hz and the frame size is 4096 (0.371 s) with 2/3 overlap.
Many fingerprinting algorithms work with this kind of audio representation. Some are comparing differences across time and frequency, some are looking for peaks in the image, etc.
Chromaprint processes the information further by transforming frequencies into musical notes. We are only interested in notes, not octaves, so the result has 12 bins, one for each note. This information is called "chroma features". (I believe they were mentioned in the paper Audio Thumbnailing of Popular Music Using Chroma-Based Representations for the first time.) After some filtering and normalization, the final image looks like this:

Now we have a representation of the audio that is pretty robust to changes caused by lossy codecs or similar things and also it isn't very hard to compare such images to check how "similar" they are, but if we want to search for them in a database, we need a more compact form. The idea how to do it again comes from the Computer Vision for Music Identification paper with some modifications based on the Pairwise Boosted Audio Fingerprint paper. You can imagine having a 16x12 pixel large window and moving it over the image from the left to the right, one pixel at a time. This will generate a lot of small subimages. On each of them we apply a pre-defined set of 16 filters that capture intensity differences across musical notes and time. What the filters do is they calculate the sum of specific areas of the grayscale subimage and then compare the two sums. There are six possible ways to arrange the areas:

You can basically take any of the six filter images, place it anywhere on the subimage and also make it as large as you want (as long as it fits the 16x12 pixel subimage). Then you calculate the sum of the black and white areas and subtract them. The result is a single real number. Every filter has three coefficients associated with it, that say how to quantize the real number, so that the final result is an integer between 0 and 3. These filters and coefficients were selected by a machine learning algorithm on a training data set of audio files during the development of the library.
There is 16 filters and each can produce an integer that can be encoded into 2 bits (using the Gray code), so if you combine all the results, you get a 32-bit integer. If you do this for every subimage generated by the sliding window, you get the full audio fingerprint. The simplest way to compare such fingerprints is to calculate bit error rates. I took the last UNKLE album and generated a few fingerprints for the original FLAC files as well as low quality 32 kbps MP3 versions and differences between them:

Heaven FLAC

Heaven 32kbps MP3

Differences between Heaven FLAC and Heaven 32kbps MP3

Under The Ice FLAC

Under The Ice 32kbps MP3

Differences between Under The Ice FLAC and Under The Ice 32kbps MP3

Differences between Heaven FLAC and Under The Ice FLAC
You can see that there is very few differences when comparing FLAC and MP3 of the same track, but comparing two different tracks will generate a lot of noise. It's not perfect and some parts could be done differently to improve the rates, but overall I'm pretty happy with the results. I especially like how little conflicts does the algorithm generate, even on the individual subfingerprints.
Update:
Examples images for some instrumental versions of songs:

Differences between instrumental and normal versions of Britney Spears - Toxic

Differences between instrumental and normal versions of Coldplay - Viva la Vida